Quick Answer
Head circumference percentile = Φ(z) × 100, where z = (measurement ÷ M) − 1, divided by S, using the WHO head-circumference-for-age tables. A boy of 4 months measuring 41.5 cm sits on the 45.6th percentile, a z-score of −0.11, against a median of 41.6 cm for that age.
How the percentile is worked out
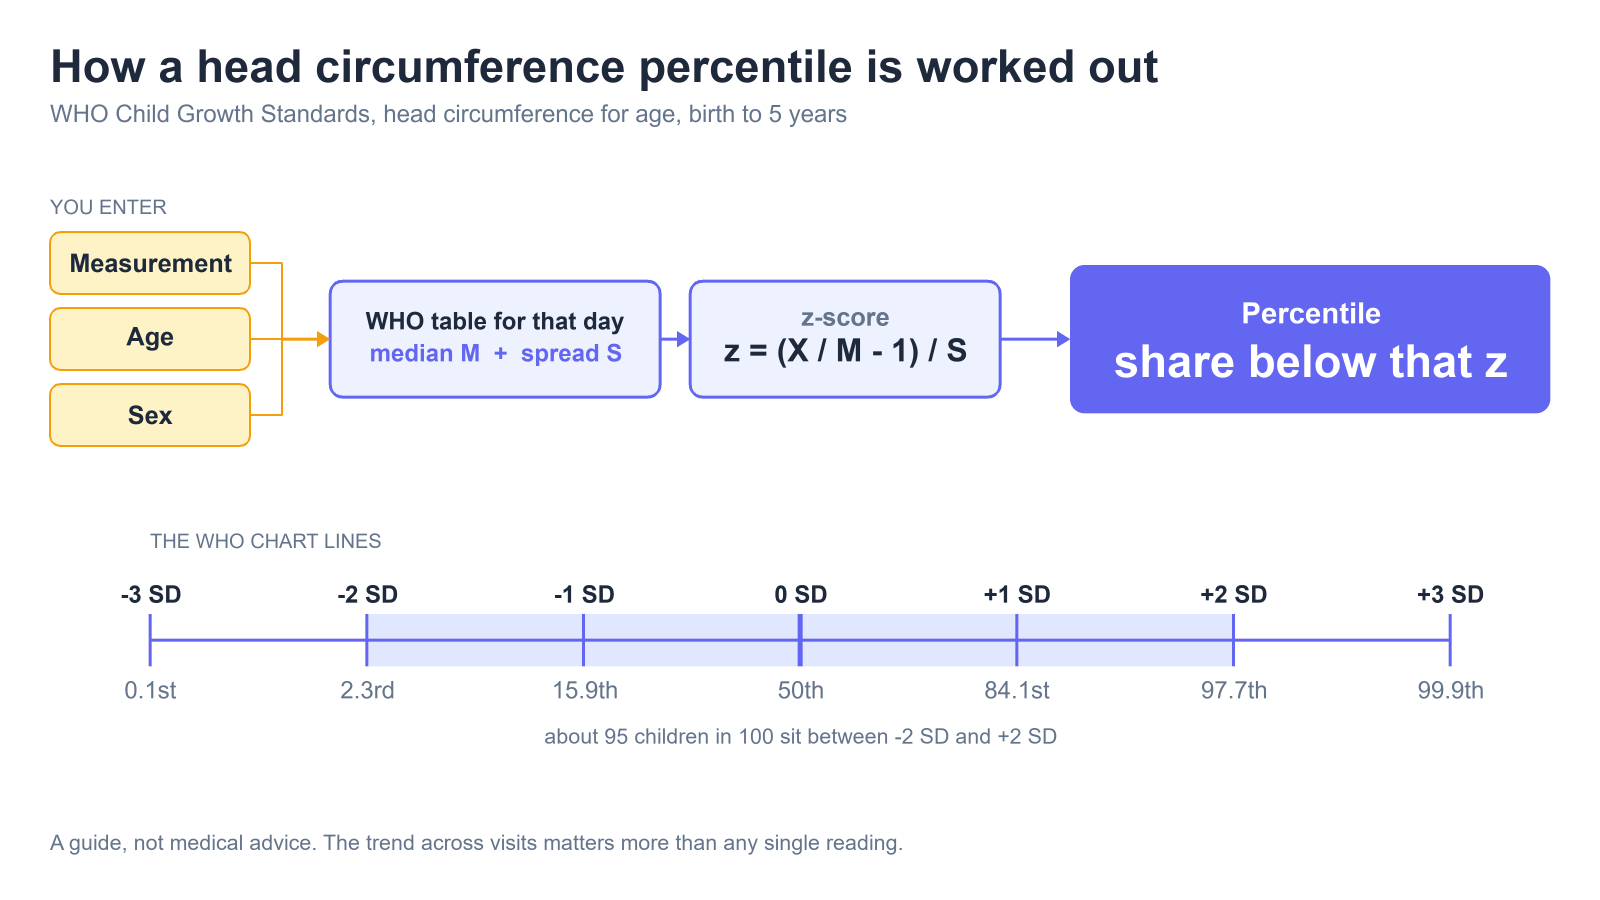
The calculator uses the WHO Child Growth Standards head-circumference-for-age tables and the standard LMS method. Each day of age carries three parameters: L (a skew power), M (the median) and S (the coefficient of variation).
In both the boys’ and girls’ head-circumference tables L is constant at 1, so the general LMS formula collapses to a plain z-score about the median:
percentile = Φ(z) × 100 — the share of children below that z-score on the normal curve.
Reversing it gives any chart line: measurement = M × (1 + S × z).
That reverse step is what fills the ladder under the result: it prints the head circumference for every whole standard-deviation line at your child’s exact age, with your own measurement slotted into position.
The WHO chart lines
WHO prints its growth charts with whole standard-deviation lines rather than round percentiles, so those are the lines shown here. Their percentiles are not chosen — each is just Φ(z) for that z-score:
| Line | Percentile | Meaning |
|---|---|---|
| −3 SD | 0.1st | 1 in 1,000 measure smaller |
| −2 SD | 2.3rd | about 2 in 100 measure smaller |
| −1 SD | 15.9th | about 16 in 100 measure smaller |
| 0 SD | 50th | the median |
| +1 SD | 84.1st | about 16 in 100 measure larger |
| +2 SD | 97.7th | about 2 in 100 measure larger |
| +3 SD | 99.9th | 1 in 1,000 measure larger |
Between −2 SD and +2 SD sit roughly 95 children in 100. UK-WHO paper charts label some lines as decimals for the same reason — the 0.4th and 99.6th centile lines are two-thirds of a standard deviation outside the 2.3rd and 97.7th.
How to use the calculator
- Pick the sex.
Boys and girls have separate WHO tables, and the difference is real — about 0.6 cm at birth. Choosing the wrong one shifts the percentile noticeably.
- Enter the age and pick the unit.
Days, weeks, months or years. Use days or weeks for a newborn, months after that. A month here is 365.25 ÷ 12 days, which is how the WHO tables are keyed.
- Enter the measurement in cm or inches.
Type the number and switch the unit beside it. Results appear in both units either way.
- Read the percentile and the ladder.
You get the exact percentile, the z-score, the nearest WHO line, the median for that exact age, and the full −3 SD to +3 SD ladder with your child’s row marked.
Measuring it properly
Technique moves the number more than most parents expect, so it is worth getting right. RCPCH guidance for health professionals states: “When measuring the head circumference use a narrow tape, either paper or plastic.”
Pass the tape around the widest part of the head — above the eyebrows and ears, and around the back where the skull sticks out most. Keep it flat against the scalp rather than angled, and take the largest of three readings.
Worked example
A boy of 4 months measuring 41.5 cm — the calculator’s own default, so you can open it and check every figure below.
| Output | Value |
|---|---|
| Percentile | 45.6th |
| Z-score | −0.11 SD |
| Nearest chart line | 0 SD (50th) |
| Median for that age | 41.6 cm |
So this baby sits a tenth of a standard deviation below the median — for practical purposes, on the middle line. The ladder for that exact age:
| Line | Head circumference |
|---|---|
| −3 SD · 0.1st | 38.0 cm (15.0 in) |
| −2 SD · 2.3rd | 39.2 cm (15.4 in) |
| −1 SD · 15.9th | 40.4 cm (15.9 in) |
| this baby | 41.5 cm (16.3 in) |
| 0 SD · 50th | 41.6 cm (16.4 in) |
| +1 SD · 84.1st | 42.8 cm (16.9 in) |
| +2 SD · 97.7th | 44.0 cm (17.3 in) |
| +3 SD · 99.9th | 45.2 cm (17.8 in) |
Notice how tight the bands are: the whole normal range at this age spans about 4.8 cm between the 2.3rd and 97.7th lines. That is why a half-centimetre measuring error matters, and why the trend across visits tells you far more than any single reading.
Median head circumference by age
The 50th centile, straight from the WHO tables. A child well above or below these can be growing perfectly normally if they track along their own line.
| Age | Boys (50th) | Girls (50th) |
|---|---|---|
| Birth | 34.5 cm | 33.9 cm |
| 3 months | 40.5 cm | 39.5 cm |
| 4 months | 41.6 cm | 40.6 cm |
| 6 months | 43.3 cm | 42.2 cm |
| 12 months | 46.1 cm | 44.9 cm |
| 2 years | 48.3 cm | 47.2 cm |
| 5 years | 50.7 cm | 49.9 cm |
Head size is one strand of growth. For the same child’s weight against the UK-WHO charts, the baby weight percentile calculator works the same way on the weight-for-age tables.